Economy
Pension Funds Missing Out On Equity Market Performance

By Quantitative Financial Analytics
Nigerian pension funds continue to show resilience and strength so far in 2017 as they gather improvements in performance but it seems that no matter how hard they try, they are lagging the performance of pure equity portfolios.
All the major indexes in Nigeria are recording mouth-watering performances in the upper double digits except NSE Insurance and NSE Oil and Gas Index whose performance is of single digits.
While NSE Banking index has generated a YTD return of 64.07%, NSE Pension index is showing its strength at 58.48% YTD return.
Not to be out done, the NSE Premium index is standing tall with a YTD return of 51.64%, the NSE Stock Index 30 is also doing the same with a return of 45.44%.
The NSE Industrial, Lotus Islamic and NSE Consumer indexes are proud of themselves with YTD returns of 42.27%, 30.66% and 37.36% respectively but the All-Share Index is beating them with its YTD return of 41.78%.
The fundamentals of the economy are so strong as reflected by the Nigerian equity market that the S&P Nigerian Sovereign index is doing better than the S&P African Sovereign Index. It may take the efforts of financial historians to remember the last time the market did so good.
Even among individual equities that trade on the floor of the exchange, a great majority have rewarded their holders with fantastic returns.
May and Baker has recorded a 261% return YTD, Stanbic IBTC Holdings, 168.24%, Fidson Healthcare Plc, 146.54% to mention but a few although there still are a few like MRS Oil, Forte Oil Plc and 7-Up Bottling Co that are still making negative returns.
For those saving for their retirement through various pension schemes, there is the temptation to find out how good their pensions are doing in the light of the performance of the equity market.
To such investors, my take on that question is that the pension funds are doing good but not so good comparatively.
Among the pension funds in the RSA category, only 6 can boast of double digit YTD returns with APT RSA fund taking the lead with 15.37% followed by AIICO pension RSA fund with 10.02%, according to analysis by Quantitative Financial Analytics.
The good news however is that all the RSA funds are showing positive YTD returns of some sort.
The story is the same among the Retiree fund category in which APT Pension fund leads the YTD return ranking with 14.94% followed by Crusader Pension Retiree fund with 12.81%. Like the RSA funds, all the Retiree funds show positive YTD returns.
There is no doubt that the Nigerian pension fund industry has been very resilient through thick and thin.
When the market headed south in Q2 2016, pension funds held their own and put some smiles of the faces of retirement minded investors and savers.
However, pension funds seem to be missing out on the current equity market performance mostly because of the asset classes pension funds are allowed by regulation to allocate their capital to.
In keeping with such regulatory requirements, Nigerian pension funds have only about 7.45% of their assets in the domestic equity market, according to analysis of latest data from Pencom.
With such little exposure to the equity market, it is difficult not to be hurt when the equity market performs good like it is doing now.
Another reason why pension funds are missing out on the largesse of the stock market is the low correlation between the stock market (All-Share Index) and pension funds.
Per analysis conducted by Quantitative Financial Analytics, many of the pension funds have low correlation to the market.
Correlation is a ratio that measures the degree to which asset types like stocks, bonds, pension funds or mutual funds move up and down at the same time.
When two asset types are highly correlated, they tend to move up or down together but when they have low correlation between them, then they do not gyrate up or down together as much as when they are highly correlated.
In another analysis, Quantitative Financial Analytics measured the relationship between the stock market and pension funds by calculating the beta of the pensions in relation to the All-Share index. The analysis reveals that Nigerian pension funds have very low beta with respect to the equity market. The result of these analysis is not surprising given that the asset allocation strategies of the pensions is over weight in bonds and other fixed securities.
The implication of this is that the pension funds do not move in tandem with the market. It is agreed that pension funds need to be pursue conservative investment strategies to reduce the risk of loss of investors’ capital, it may be reasonable to increase exposure to the equity market in such a way that returns can be maximized while controlling risk.
Pension fund investors should however take solace in the fact that what they are missing in high performance they are gaining in low risk.
A risk analysis conducted by Quantitative Financial Analytics using the standard deviation of returns for pension funds and equities shows that the pension funds are much less risky than equities.
While the seemingly riskiest pension fund has a standard deviation of 1.37, the corresponding number for equities is 31.58, according to the analysis.
Investment performance analysis experts are united in the opinion that risk adjusted returns are more meaningful than absolute returns. So pension fund investors can go to sleep in comfort knowing that what they lost in capital appreciation they gain in capital preservation.


Most traders evaluate a strategy by looking at its historical performance.
Common metrics such as total return, win rate, profit factor, maximum drawdown, and Sharpe ratio provide valuable information about how a strategy performed in the past.
The problem is that historical performance tells only one story.
Financial markets are inherently uncertain. Even a strategy with an impressive backtest can experience very different outcomes once it encounters changing market conditions, unexpected volatility, or an unfavorable sequence of trades.
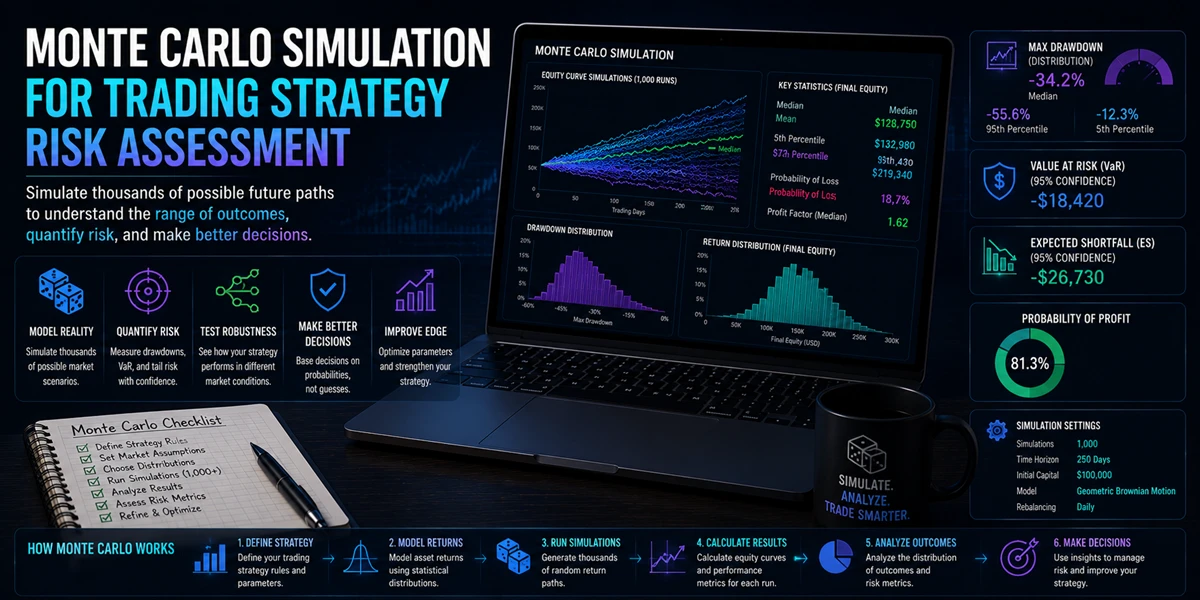
This is why professional traders, quantitative researchers, and portfolio managers increasingly rely on Monte Carlo simulation as part of their risk assessment process.
Rather than focusing on a single historical outcome, Monte Carlo analysis explores thousands of possible scenarios, helping traders understand what could happen—not just what already happened.
Why Historical Performance Is Only Part Of The Picture
Backtesting remains one of the most important tools in strategy development.
Platforms such as MetaTrader 5 provide sophisticated testing environments that allow traders to evaluate Expert Advisors and trading systems using historical market data.
A typical backtest may show:
| Metric | Result |
|---|---|
| Net Profit | 35% |
| Win Rate | 54% |
| Maximum Drawdown | 12% |
At first glance, these numbers appear encouraging.
However, every backtest contains one important limitation:
History occurred only once.
The strategy followed a specific sequence of winning and losing trades. If those same trades had occurred in a different order, the overall experience could have looked very different.
This is where Monte Carlo analysis becomes valuable.
Understanding Sequence Risk
One of the most important concepts in Monte Carlo simulation is sequence risk.
Consider a simple series of trades:
| Trade | Result |
|---|---|
| 1 | +3% |
| 2 | +2% |
| 3 | -1% |
| 4 | +4% |
| 5 | -2% |
The overall result is positive.
However, if those same trades occurred in a different order:
| Trade | Result |
|---|---|
| 1 | -2% |
| 2 | -1% |
| 3 | +2% |
| 4 | +3% |
| 5 | +4% |
the final return may remain similar while the path becomes significantly more difficult.
The trader may experience:
- Larger drawdowns
- Longer recovery periods
- Increased psychological pressure
- Greater capital requirements
The strategy itself has not changed.
Only the sequence has changed.
Monte Carlo simulation explores thousands of these alternative scenarios to estimate how different trade sequences may influence future performance.
Exploring Thousands Of Possible Outcomes
Monte Carlo analysis works by generating large numbers of alternative outcomes based on historical strategy behavior.
A simplified process looks like this:
Historical Trade Results
        ↓
    Randomization
        ↓
     Simulation
        ↓
Repeat Thousands of Times
        ↓
    Risk Analysis
Each simulation represents a plausible alternative version of history.
By repeating this process thousands of times, traders can estimate:
- Potential drawdowns
- Losing streak probabilities
- Capital requirements
- Performance variability
- Confidence intervals
The objective is not to predict the future.
The objective is to understand uncertainty.
Looking Beyond Average Returns
Many traders focus heavily on expected returns.
Risk professionals often focus on worst-case outcomes.
Consider two strategies:
| Metric | Strategy A | Strategy B |
|---|---|---|
| Average Return | 20% | 20% |
| Historical Drawdown | 10% | 10% |
At first glance, they appear nearly identical.
Monte Carlo analysis may reveal a different story:
| Risk Metric | Strategy A | Strategy B |
|---|---|---|
| Worst Simulated Drawdown | 18% | 35% |
| Probability of 20% Drawdown | 5% | 27% |
Although historical results appear similar, future risk characteristics may differ significantly.
This is one reason why institutional investors rarely rely solely on traditional backtest statistics.
The Reality Of Losing Streaks
One of the most underestimated aspects of trading is the impact of consecutive losses.
Even profitable strategies can experience difficult periods.
For example:
| Consecutive Trades |
|---|
| Loss |
| Loss |
| Loss |
| Loss |
| Loss |
| Loss |
Such sequences are completely normal.
However, they often create emotional pressure and lead traders to abandon otherwise profitable systems.
Monte Carlo analysis helps estimate:
- Expected losing streak lengths
- Worst-case losing streaks
- Probability of extended downturns
- Recovery requirements
Understanding these possibilities allows traders to set more realistic expectations before real capital is exposed.
Position Sizing And Capital Preservation
Position sizing is one of the most important applications of Monte Carlo analysis.
Even profitable strategies can fail if risk per trade is too aggressive.
Monte Carlo simulations help answer questions such as:
- How much capital is required?
- What position size is sustainable?
- What drawdown level is acceptable?
- What is the probability of account depletion?
For example, a strategy may appear relatively safe at 1% risk per trade.
The same strategy may exhibit a significant probability of severe drawdowns when risk increases to 5% per trade.
Understanding these relationships often leads to better risk-management decisions.
Portfolio Risk And Diversification
Monte Carlo simulation is not limited to individual strategies.
Portfolio managers frequently use it to evaluate:
- Multi-strategy portfolios
- Multi-asset portfolios
- Diversification effects
- Correlation risks
A portfolio may appear well diversified based on historical data.
However, asset relationships can change unexpectedly during periods of market stress.
Monte Carlo analysis helps traders evaluate how portfolios may behave under alternative scenarios rather than relying solely on historical observations.
Randomness Plays A Bigger Role Than Most Traders Realize
One of the most important lessons of Monte Carlo analysis is that randomness influences results more than many traders expect.
A profitable strategy can experience:
- Unfavorable timing
- Extended drawdowns
- Long losing streaks
- Temporary underperformance
without any deterioration in the underlying strategy.
Understanding this distinction helps traders separate:
| Normal Statistical Variation | Genuine Strategy Problems |
|---|---|
| Temporary drawdowns | Structural performance decline |
| Random losing streaks | Broken trading logic |
| Short-term underperformance | Changing market assumptions |
This perspective is essential for long-term strategy management.
Monte Carlo As Part Of A Complete Validation Process
Monte Carlo analysis works best when combined with other research methods.
Many professional workflows follow a process similar to:
| Step | Process |
|---|---|
| 1 | Strategy Development |
| 2 | Historical Backtesting |
| 3 | Optimization |
| 4 | Monte Carlo Analysis |
| 5 | Forward Testing |
| 6 | Deployment |
| 7 | Ongoing Monitoring |
The broader MetaTrader ecosystem supports many stages of this workflow through strategy testing, optimization, algorithmic development, and performance analysis tools.
The objective is not simply to find profitable strategies.
The objective is to understand how those strategies may behave when market conditions become less favorable.
Why Professional Firms Use Monte Carlo Analysis
Institutional investment firms focus on risk as much as return.
Their goal is not only to identify profitable opportunities but also to understand:
- Capital requirements
- Worst-case scenarios
- Portfolio resilience
- Survival probabilities
These considerations become increasingly important as capital allocations grow larger.
The same principles can benefit independent traders.
A strategy with slightly lower returns but substantially lower risk may ultimately prove more sustainable over the long term.
Understanding Risk Beyond The Backtest
Historical performance provides valuable information, but it tells only part of the story.
Monte Carlo simulation helps traders explore the uncertainty that exists beyond a single backtest result. By generating thousands of alternative scenarios, the technique provides insight into drawdowns, losing streaks, capital requirements, and portfolio resilience.
As algorithmic trading becomes increasingly sophisticated, risk assessment is becoming just as important as strategy development itself.
The most successful traders are often not those who find the highest returns.
They are those who understand the risks behind those returns and prepare for outcomes that may never appear in a traditional backtest.
In modern quantitative trading, understanding uncertainty can be just as valuable as identifying opportunity.

By Adedapo Adesanya
Nigeria attracted $10.37 billion in capital importation in the first quarter of 2026, representing an 83.8 per cent increase from the $5.64 billion recorded in the corresponding period of 2025, according to the National Bureau of Statistics (NBS).
The latest Capital Importation Report released by the stats bureau also showed that capital inflows rose by 60.97 per cent from $6.44 billion recorded in the fourth quarter of 2025.
The report stated, “In Q1 2026, total capital importation into Nigeria stood at $10.37bn, higher than $5.64bn recorded in Q1 2025, indicating an increase of 83.83 per cent. In comparison to the preceding quarter, capital importation increased by 60.97 per cent from $6.44bn in Q4 2025.”
Analysis of the inflows showed that portfolio investment remained the dominant source of foreign capital, accounting for $9.86 billion or 95.09 per cent of the total amount imported into the economy.
The stats office disclosed that foreign direct investment stood at $135.08 million, representing only 1.30 per cent of total capital inflows, while other investments accounted for $374.48 million or 3.61 per cent.
“Portfolio Investment ranked top with $9.86bn, accounting for 95.09 per cent, followed by Other Investment with $374.48m, accounting for 3.61 per cent. Foreign Direct Investment recorded the least with $135.08m, representing 1.30 per cent of total capital importation in Q1 2026,” the report added.
A further breakdown showed that money market instruments attracted the largest share of portfolio investments at $6.50 billion, while investments in bonds amounted to $3.23 billion.
Equity investments under the portfolio category stood at $131.81 million.
The banking sector emerged as the biggest destination for foreign capital during the quarter, attracting $7.55 billion, representing 72.79 per cent of total inflows.
The financing sector followed with $2.43 billion or 23.42 per cent, while the production and manufacturing sector attracted $152.27 million, accounting for 1.47 per cent of total capital imported.
Other sectors that received foreign investments included shares, trading, agriculture, information technology services, telecommunications, oil and gas, transport, construction, healthcare, education, and consultancy services.
The United Kingdom remained Nigeria’s largest source of foreign capital, accounting for $5.08 billion or 49.01 per cent of total inflows. The United States followed with $3.18 billion, representing 30.69 per cent, while South Africa accounted for $983.83 million or 9.49 per cent.
Among financial institutions, Standard Chartered Bank Nigeria Limited received the highest capital inflow during the quarter at $4.41 billion, representing 42.56 per cent of the total.
Stanbic IBTC Bank Plc followed with $2.78 billion or 26.79 per cent, while Rand Merchant Bank handled $930.82 million, accounting for 8.97 per cent.
Other banks that facilitated capital inflows into the country during the period included Citibank Nigeria, Access Bank, First Bank of Nigeria, Guaranty Trust Bank, Zenith Bank, FCMB, Ecobank, Fidelity Bank, and United Bank for Africa.

By Aduragbemi Omiyale
The 2026 licensing round for oil fields is expected to commence in the third quarter of 2026, the Nigerian Upstream Petroleum Regulatory Commission (NUPRC) has disclosed.
This followed the approval of President Bola Tinubu, who doubles as the Minister of Petroleum Resources.
A statement issued by the spokesperson of NUPRC, Mr Eniola Akinkuotu, on Wednesday said the authorisation is in compliance with the Petroleum Industry Act (PIA).
“We are also fortunate that the President and Minister of Petroleum Resources has approved the 2026 Licensing Round,” the chief executive of the agency, Mrs Oritsemeyiwa Eyesa, was quoted as saying in the statement when she received representatives of Meren Energy (formerly Africa Oil) in Abuja yesterday.
Mrs Eyesan, who expressed satisfaction with the conduct of the 2025 Licensing Round so far, stated that the commercial bid would take place in July, after which the next licensing round would commence.
The NUPRC boss said the heightened participation in the 2025 Licensing Round was a testament to the fact that Nigeria was headed in the right direction.
She said the rise in investments, coupled with the upswing in production, was evidence that Nigeria’s oil and gas sector, under the leadership of President Bola Tinubu, had become attractive.
“We are in the process of finalising the 2026 launch, which will happen by the third quarter at the latest. So, this is the make-or-break point, and we want to make sure we make it,” she stated.
In his remarks, the chief executive of Meren Energy, Mr Oliver Quinn, said the current reforms had inspired the company to increase its investments in Nigeria, hence its interest in asset divestments and licensing rounds, revealing that his company’s investment priority is Africa, of which Nigeria ranks as number one.
“We have operated in Agbami, Akpo and Egina world-class fields. I think till date, in 20 years, about $11bn in capital from our side has gone into these assets, and about $4bn has gone to tax and royalties,” he said, adding, “Nigeria remains the core of our business today because of the quality of these assets.”
According to Mr Quinn, Meren Energy is pressuring its partners on these assets to deepen their investments and then increase overall production, noting that the energy firm was the first in Nigeria to sell crude oil to the Dangote refinery and will continue to fulfil its Domestic Crude Supply Obligation so long as the price remains right.
-
 Feature/OPED6 years ago
Davos was Different this year
-
Travel/Tourism10 years ago
Lagos Seals Western Lodge Hotel In Ikorodu
-

 Showbiz3 years ago
Estranged Lover Releases Videos of Empress Njamah Bathing
-
 Banking8 years ago
Sort Codes of GTBank Branches in Nigeria
-

 Economy3 years ago
Subsidy Removal: CNG at N130 Per Litre Cheaper Than Petrol—IPMAN
-

 Banking3 years ago
Sort Codes of UBA Branches in Nigeria
-

 Banking3 years ago
First Bank Announces Planned Downtime
-

 Sports3 years ago
Highest Paid Nigerian Footballer – How Much Do Nigerian Footballers Earn