
Economy
NNPC Raises Daily Gas Supply to Power Plants by 64%


By Modupe Gbadeyanka
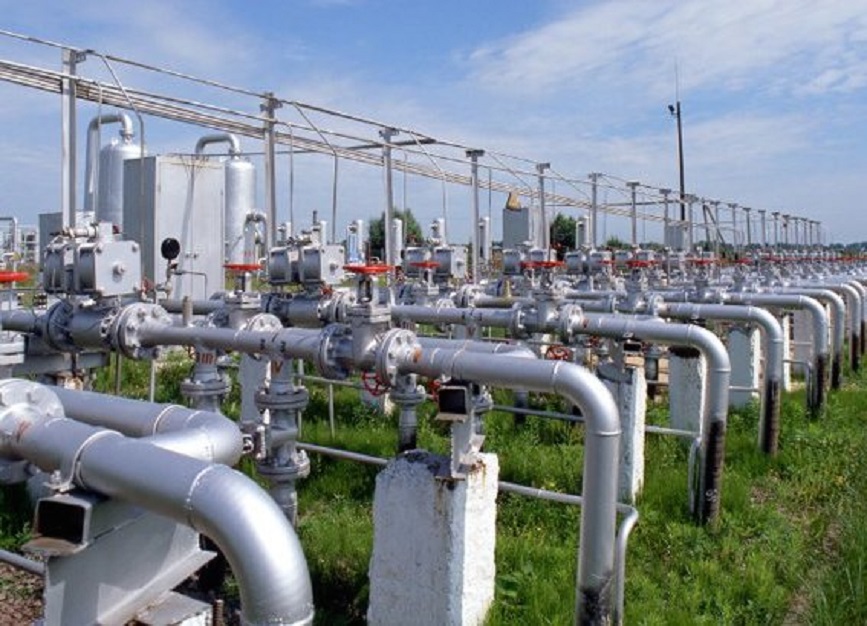
The Nigerian National Petroleum Corporation (NNPC) has disclosed that the average national daily gas supply to the nation’s power plants has risen by 64 percent.
The state-owned oil firm, in its Financial and Operations Report for May 2017 released today in Abuja, disclosed that the average Natural Gas supply to power plants of 729 million standard cubic feet of gas per day (mmscfd) in May 2017 was 63.74 percent higher than the daily gas supply to the plants, of 446mmscfd, during the same month in 2016.
The report said the average national daily gas production for May 2017 stood at 242.70 billion cubic feet (BCF) or an average of 7,829.11mmscfd, representing a slight increase, compared with April gas production of 672mmscfd.
It also stated that NNPC, within the period under review, activated plans to build 500 million standard cubic feet of gas-per-day metering plant to serve the planned capacity expansion of Egbin Power Plant.
The report, the 22nd edition, like the previous ones, is designed to promote and sustain effective communication with stakeholders.
According to the report, the three refineries in Port Harcourt, Warri and Kaduna were operational in May 2017, with a minimum of 6m litres of PMS, otherwise called petrol, and a similar quantity of Automotive Gas Oil, also known as diesel, loaded out from the refineries daily.
The three NNPC refineries have a combined nameplate capacity of 445,000 barrels of crude oil per stream day.
The report indicated that the rehabilitation of the refineries would restore their nameplate capacities.
Diesel price, the report also noted, witnessed a nationwide crash by as much as 42 percent following strategic intervention by the Corporation to sustain supply of diesel and avoid the first quarter, 2017 unpleasant experience when retail price of AGO shot to an all-time high of N300 per litre.
The intervention pushed the product’s retail prices as at May 2017 to rally between N175 and N200 across the country.
Another highpoint of the May report is that there was a decline in the incidents of oil pipeline breaks which had, in recent time, witnessed a steady reduction through the months following the sustained community/stakeholders’ engagement initiative.
It further said that the number of pipeline breaks recorded within the period stood at 55, which was an improvement compared to 82 vandalized points recorded in April 2017.
This figure represents about 33 per cent reduction relative to the previous months and also a remarkable improvement to corresponding period of May 2016 which recorded 260 cases.
During the period under review, the reports informed that NNPC stepped up efforts to actualize government’s initiative on co-location of some refineries.


By Adedapo Adesanya
The Eggs Sellers and Distributors Association of Nigeria (ESDAN) has kicked against the proposed plan involving the production of egg powder to tackle the glut of eggs.
The National President of ESDAN, Mrs Olaide Graham, made the position clear in an interview with the News Agency of Nigeria (NAN) this week.
Egg glut occurs when egg production exceeds consumer demand, resulting in a surplus that often forces farmers to sell at reduced prices to avoid spoilage.
The Lagos State Government recently announced plans to establish an egg powder processing facility as part of efforts to address seasonal egg glut in the poultry sector.
Mrs Graham described the initiative as a welcome development but maintained that it would not address the fundamental challenges facing the industry.
“The establishment of an egg powder factory in Lagos to address the egg glut situation will have a positive impact if it is properly implemented and the product meets market standards.
“It could help reduce waste and, to some extent, stabilise prices temporarily.
“However, egg powder may not be widely accepted as a substitute for fresh eggs in this part of the country because of differences in taste, texture and consumer perception.
“Many consumers still regard fresh eggs as more nutritious,” she said.
According to her, the major issue is identifying and addressing the root causes of the egg glut rather than focusing solely on processing surplus eggs.
“We have a population of over 200 million people. Why should there be an egg glut?
“We need to examine what farmers, distributors and other stakeholders are not getting right and provide the necessary support.
“Egg powder is not the cure for egg glut in Nigeria. Stakeholders should come together to identify sustainable solutions,” she said.
Mrs Graham noted that egg powder could serve as a raw material for the production of other goods, but should not be viewed as a long-term remedy for the challenge.
She emphasised the need for improved distribution systems across the egg value chain.
“Effective distribution can go a long way in addressing the problem.
“We should remember that Lagos distributes not only eggs produced within the state but also eggs brought in from other parts of the country.
“In every challenge, there is always a solution, but egg powder is not the major solution to egg glut,” she said.
The ESDAN president also dismissed concerns that egg distributors could be negatively affected by the proposed factory.
“Distributors have nothing to fear because Nigerians are accustomed to consuming fresh eggs.
“The number of consumers who will continue to prefer fresh eggs will still be higher.
“Even if egg powder production affects access to fresh eggs, there will still be ways to address that challenge.“If the purpose of producing egg powder is to reduce glut, then that is why distributors have joined the conversation,” she said, according to the news agency.

By Adedapo Adesanya
The Minister of Finance and Coordinating Minister of the Economy, Mr Taiwo Oyedele, says that reliance on aid and concessional finance was neither sustainable nor sufficient.
He said this at the opening of a high-level capacity-building session in Abuja on Wednesday, noting that Nigeria needs to strengthen local funding sources, a message that also guided discussions during a visit by an Ethiopian delegation to learn about Nigeria’s Integrated National Financing Framework (INFF).
“Domestic Resource Mobilisation remains the most critical pillar of any credible financing framework”, he said. “Our objective is not to increase the burden on citizens. Our objective is to create a fairer, more efficient and growth-oriented revenue system that supports development, encourages enterprise and strengthens voluntary compliance.”
The minister presented Nigeria’s INFF as a practical, evolving response to the continent’s widening financing gap for the Sustainable Development Goals (SDGs) and Agenda 2063.
He outlined the process that had produced the framework — a Development Finance Assessment, a multi-stakeholder steering committee and a Financing Strategy aligned with the Medium-Term National Development Plan.
He also cited concrete reforms such as expanded digitalisation of tax administration, deeper engagement with international capital markets through green and sustainability-linked instruments and institutionalised accountability mechanisms.
“These are not merely technical outputs,” Mr Oyedele said. “They are the instruments by which we mobilise, align and deploy financing to turn plans into services — schools, clinics, roads and social protection for our people.”
He insisted the INFF was “a living framework” that would continue to adapt as Nigeria sought to deepen private-sector participation, mobilise climate finance and strengthen subnational financing architecture.
The minister’s emphasis on sovereign revenue came with a direct appeal to state actors, urging states to pursue reforms that would increase the tax-to-GDP ratio without unduly burdening households.
Mr Oyedele positioned the INFF as the mechanism to reduce external dependence by aligning public, private, domestic and international finance with national priorities.
“This is not cause for despair”, he said of Africa’s financing gap. “Rather, it is an opportunity to rethink how development is financed and to ensure that every available source of capital is aligned with national priorities.”
Addressing the Ethiopian delegation directly, Mr Oyedele framed the engagement as mutual learning, stating: “Nigeria does not claim to have all the answers. Rather, we offer our experience in the spirit of partnership, transparency and mutual learning. Ask difficult questions. Challenge assumptions. Share your innovations and experiences.”
In her remarks, the Senior Special Assistant to the President on SDGs, Mrs Adejoke Orelope-Adefulire, told delegates that the capacity of states to effectively mobilise, manage and deploy financial resources directly influenced the quality of life of millions of Nigerians.
She stressed that states must carry constitutional responsibility for primary healthcare, basic education, water and sanitation and other frontline services.
She also warned that current revenue and institutional weaknesses at the subnational level threatened service delivery across the country.
“The fiscal realities confronting many sub-national governments — rising expenditure pressures, limited internally generated revenue, growing infrastructure deficits, climate-related vulnerabilities and global economic uncertainties — are battering state finances,“ Mrs Orelope-Adefulire said. “Addressing these issues requires innovative thinking, bold reforms and stronger collaboration among all key stakeholders.”
On her part, UNDP Resident Representative, Ms Elsie Attafuah, echoed the call for domestic solutions while emphasising the value of peer learning.
“The Sustainable Development Goals are ultimately delivered in states, provinces, cities and communities,” she said. “This is why strengthening fiscal capacity at the state level is not simply a revenue issue. It is fundamentally a development issue.”
Ms Attafuah commended Nigeria’s reform agenda and stressed that South-South cooperation, exemplified by the Ethiopia–Nigeria exchange, could accelerate progress, noting, “No single country has all the answers. Yet every country has lessons that can help others move further and faster.”
By Adedapo Adesanya
Nigeria has launched the Early-Stage Mineral Exploration and Research Grant Endowment Program (EMERGE), a new initiative aimed at accelerating early-stage mineral exploration, strengthening geological research and advancing local value addition.
The programme is part of moves to unlock Nigeria’s $750 billion worth of untapped mineral deposits under broader efforts to diversify its economy beyond oil.
Nigeria has outlined plans to expand mineral exploration and production, identifying 44 strategic mineral deposits and is seeking developers with the requisite capital and technological expertise to invest.
The government has also sought to increase mining’s contribution to GDP to 10 per cent in 2026. However, unlocking these opportunities will require stronger geological data, greater technical capacity and increased investment in early-stage exploration.
The introduction of the EMERGE initiative aims to address these gaps. The programme is centred around three areas of focus: science-backed exploration, critical minerals development and research and development.
The exploration stream targets early-stage geological insights to generate reliable mineral data, the critical minerals stream targets minerals required for the energy transition, while the research and development stream integrates science and innovation across the value chain.
Driven by the Solid Minerals Development Fund, the programme is designed to position Nigeria as a major player in the global minerals value chain. It also builds on a rising wave of international partnerships aimed at modernising Nigeria’s exploration infrastructure through digitisation and enhanced capacity building.
Nigeria and Turkey formalised a partnership agreement in May 2026, aimed at strengthening cooperation in mining technology, exploration and investment.
Nigeria has also entered geological mapping and exploration cooperation agreements with South Sudan and South Africa, aimed at advancing geological and technical expertise while facilitating greater investment flows across the exploration sector.
Recent mineral ambitions are being backed by global finance. In March 2026, Nigeria secured $1.3 billion from the Africa Finance Corporation (AFC) to fund its mineral exploration programs as well as the construction of an alumina refinery, advancing its national mineral production and domestic beneficiation strategy.
Also, late last year, the federal government allocated over $600 million for geoscientific exploration and nationwide mapping, highlighting Nigeria’s commitment to de-risk the sector through access to modern geological data and accelerated exploration activities.

-
 Feature/OPED6 years ago
Davos was Different this year
-
Travel/Tourism10 years ago
Lagos Seals Western Lodge Hotel In Ikorodu
-

 Showbiz3 years ago
Estranged Lover Releases Videos of Empress Njamah Bathing
-
 Banking8 years ago
Sort Codes of GTBank Branches in Nigeria
-

 Economy3 years ago
Subsidy Removal: CNG at N130 Per Litre Cheaper Than Petrol—IPMAN
-
 Banking3 years ago
Sort Codes of UBA Branches in Nigeria
-

 Banking3 years ago
First Bank Announces Planned Downtime
-

 Sports3 years ago
Highest Paid Nigerian Footballer – How Much Do Nigerian Footballers Earn